Statistics
Stating the Problem
Definition Population
A population is the whole group of people or things with something in common that we want to study.
Example
The population is all the students in a college.
Definition Data
Data is the information we collect, like numbers, words, measurements, or observations.
Definition Types of Variables
- Qualitative Variable (Categorical): Describes categories or groups that cannot be measured numerically.
- Quantitative Variable (Numerical): Represents measurable quantities with numerical values.
Definition Frequency and Relative Frequency
Frequency is how many times each value or category appears.
Relative Frequency is the frequency divided by the total, often shown as a percentage.
Relative Frequency is the frequency divided by the total, often shown as a percentage.
Representing Data
Definition Pictograph
A pictograph uses pictures or symbols to show data.
Example
| 5 |  | |||
| 4 |  | | ||
| 3 | | | ||
| 2 | | | | |
| 1 |  | | | |
| Lemon | Orange | Apple | Cherry |
- Lemon: 1 student.
- Orange: 4 students.
- Apple: 5 students.
- Cherry: 2 students.
Definition Bar Chart
A bar chart shows data with bars.
Example
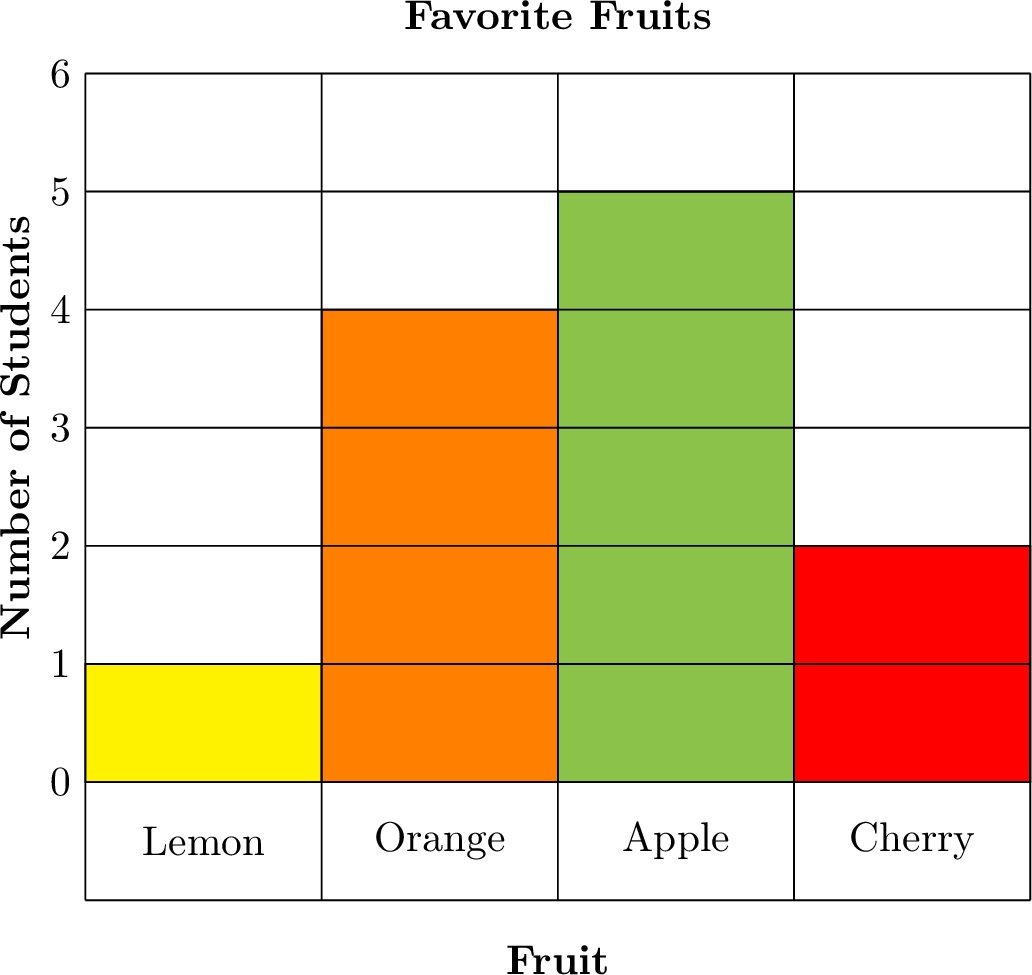
- Lemon: 1 student.
- Orange: 4 students.
- Apple: 5 students.
- Cherry: 2 students.