Relation
Definitions
Definition Relation
A relation is a way to show a relationship between two variables (quantities).
In mathematics, we often use the letters \(\textcolor{colordef}{x}\) and \(\textcolor{colorprop}{y}\) to represent the variables. But in other fields, we often represent a variable with the first letter of its name. For example, the variable time is represented by the letter \(t\).
Example
We study the height of a child at different ages.
State the two variables.
State the two variables.
- Time in years: This is the variable \(\textcolor{colordef}{t}\). It changes every year.
- Height of the child in cm: This is the variable \(\textcolor{colorprop}{h}\). It tells us how tall the child is.
Tables
Definition Table
A table is used to organize data, making it easier to display and analyze relationships between variables. Typically, each row or column in the table represents a different variable.
Example
Hugo's height as a function of age is given by the following table:
| \(\textcolor{colordef}{t\text{ (years)}}\) | \(0\) | \(1\) | \(2\) | \(3\) | \(4\) | \(5\) | \(6\) |
| \(\textcolor{colorprop}{h\text{ (cm)}}\) | \(52\) | \(67\) | \(78\) | \(86\) | \(98\) | \(106\) | \(114\) |
The height of Hugo at \(4\) years old is \(\textcolor{colorprop}{98}\) centimeters.
Graphs
Definition Graph
A graph of a relation is the set of points \((\textcolor{colordef}{x},\textcolor{colorprop}{y})\) in a plane.
Definition Line Graph
A line graph of a relation is the set of points \((\textcolor{colordef}{x},\textcolor{colorprop}{y})\) connected by straight line segments.
Method Plotting a line graph from a table
In a plane:
- we plot each point \((\textcolor{colordef}{x},\textcolor{colorprop}{y})\) from the table,
- we connect the points with straight line segments.
Example
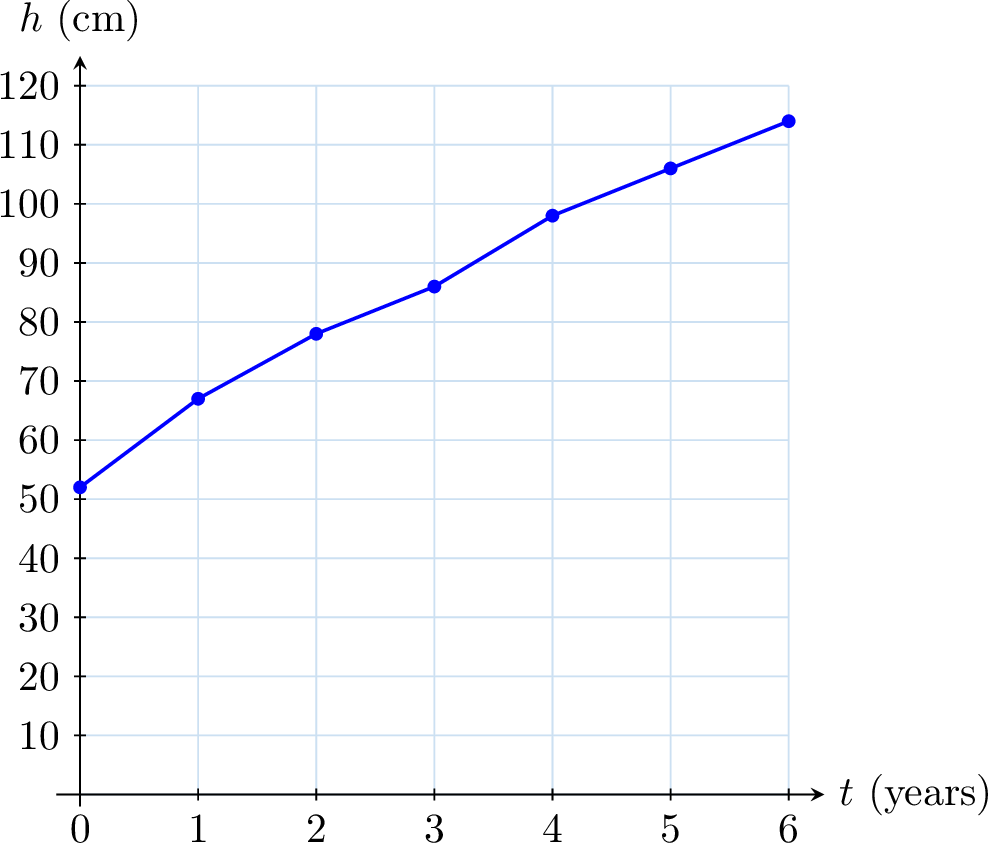
Plot the line graph of Hugo's height as a function of age, using the data below:
| \(\textcolor{colordef}{t\text{ (years)}}\) | \(0\) | \(1\) | \(2\) | \(3\) | \(4\) | \(5\) | \(6\) |
| \(\textcolor{colorprop}{h\text{ (cm)}}\) | \(52\) | \(67\) | \(78\) | \(86\) | \(98\) | \(106\) | \(114\) |
- First, plot the points \((0,52)\), \((1,67)\), \((2,78)\), \((3,86)\), \((4,98)\), \((5,106)\), \((6,114)\) on a graph.
- Then, connect the points in order with straight line segments to form the line graph.