Functions
Definitions
A function is like a machine that produces an output from an input according to a rule.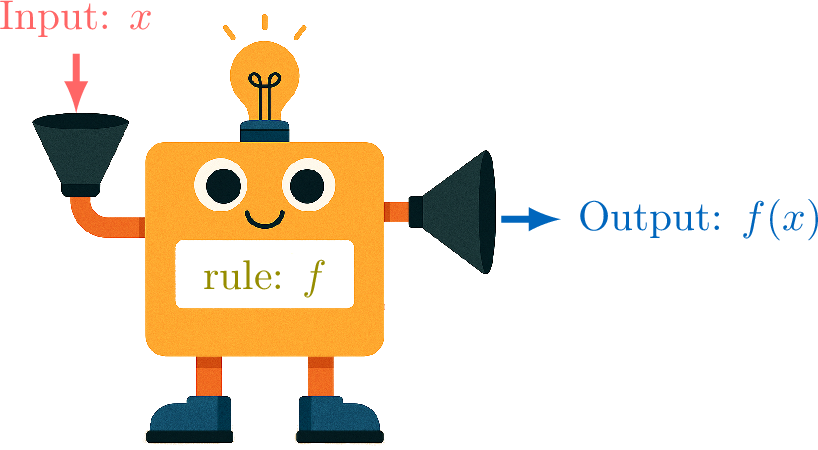
We use function notation to name functions and their variables, replacing "\(\textcolor{colordef}{\text{input}}\)" by "\(\textcolor{colordef}{x}\)" and "\(\textcolor{colorprop}{\text{output}}\)" by "\(\textcolor{colorprop}{f(x)}\)".
For example, if the rule is "twice the input":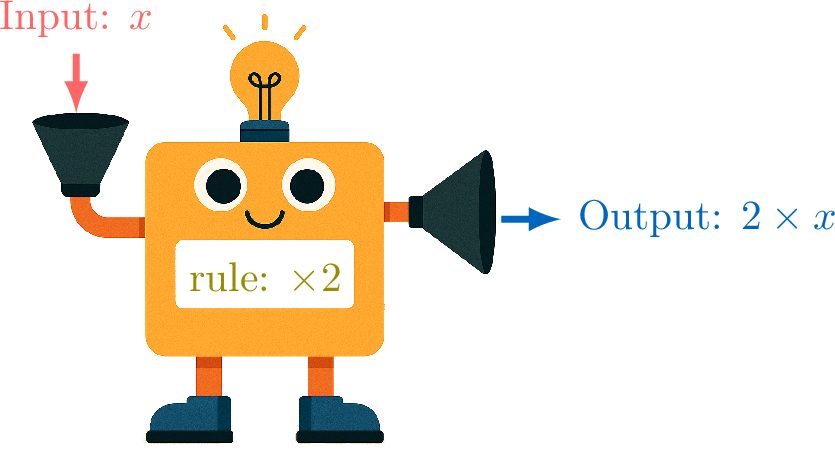
When the input is \(\textcolor{colordef}{x} = \textcolor{colordef}{1}\), we get:$$\begin{aligned}\textcolor{olive}{f}(\textcolor{colordef}{1}) &= 2 \times \textcolor{colordef}{(1)}\\ &= \textcolor{colorprop}{2}\end{aligned}$$The table of values below shows the output values for different input values: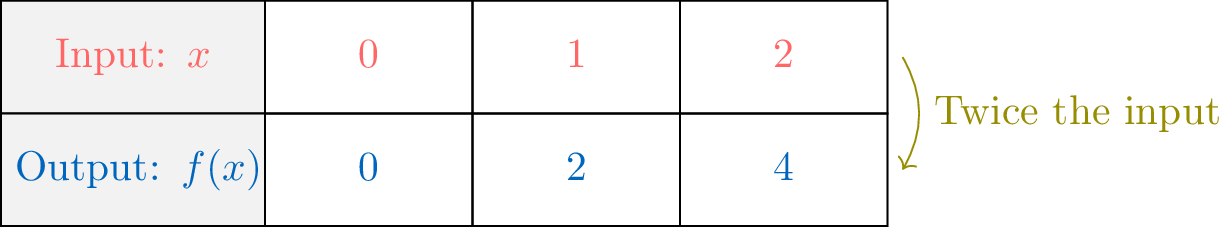
Definition Function
From an input value \(x\), a function \(f\) produces an output value \(f(x)\).
\(f(x)\) is read as "\(f\) of \(x\)".
\(f(x)\) is read as "\(f\) of \(x\)".
Example
For \(f(x)=2x-1\) (the function that doubles the input and subtracts 1), find \(f(5)\).
\(\begin{aligned}[t] f(5)&=2\times (5)-1&(\text{substituting } x \text{ by } (5))\\&=9 \end{aligned}\)
Tables of Values
Definition Table of Values
The table of values for a function \(f\) provides a listing of pairs \((x, f(x))\), where \(x\) is an input value and \(f(x)\) is the corresponding output value produced by the function \(f\).
Example
For \(f(x)=x^2\), complete the following table:
| \(x\) | \(-2\) | \(-1\) | \(0\) | \(1\) | \(2\) |
| \(f(x)\) |
- \(\begin{aligned}[t] f(-2) &= (-2)^2 & (\text{substituting } x \text{ by } (-2)) \\ &= 4 \end{aligned}\)
- \(\begin{aligned}[t] f(-1) &= (-1)^2 & (\text{substituting } x \text{ by } (-1)) \\ &= 1 \end{aligned}\)
- \(\begin{aligned}[t] f(0) &= (0)^2 & (\text{substituting } x \text{ by } (0)) \\ &= 0 \end{aligned}\)
- \(\begin{aligned}[t] f(1) &= (1)^2 & (\text{substituting } x \text{ by } (1)) \\ &= 1 \end{aligned}\)
- \(\begin{aligned}[t] f(2) &= (2)^2 & (\text{substituting } x \text{ by } (2)) \\ &= 4 \end{aligned}\)
| \(x\) | \(-2\) | \(-1\) | \(0\) | \(1\) | \(2\) |
| \(f(x)\) | \(4\) | \(1\) | \(0\) | \(1\) | \(4\) |
Graphs
Definition Graph
A graph of a function is the set of all points \((\textcolor{colordef}{x},\textcolor{colordef}{f(x)})\) in the plane, where \(x\) is an input and \(f(x)\) is its output.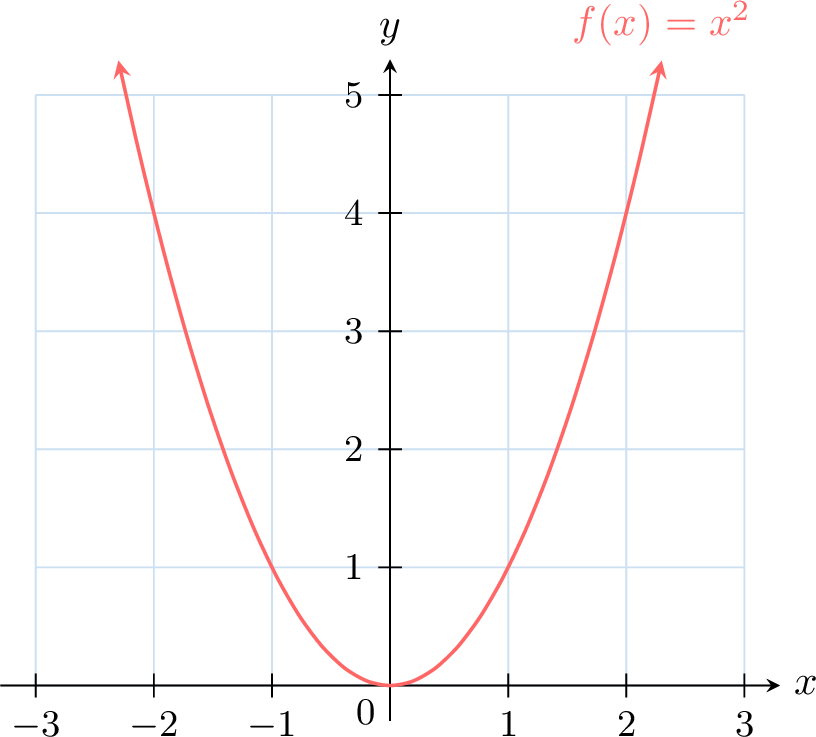
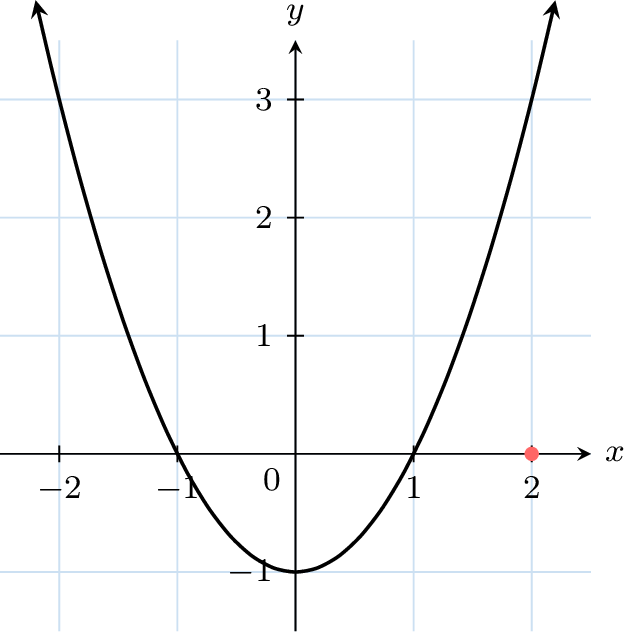
Method Finding the value \(f(x)\) using a graph
To find \(f(2)\) on a graph, follow these steps:
- Locate the \(x\)-value: Find \(x = 2\) on the \(x\)-axis.
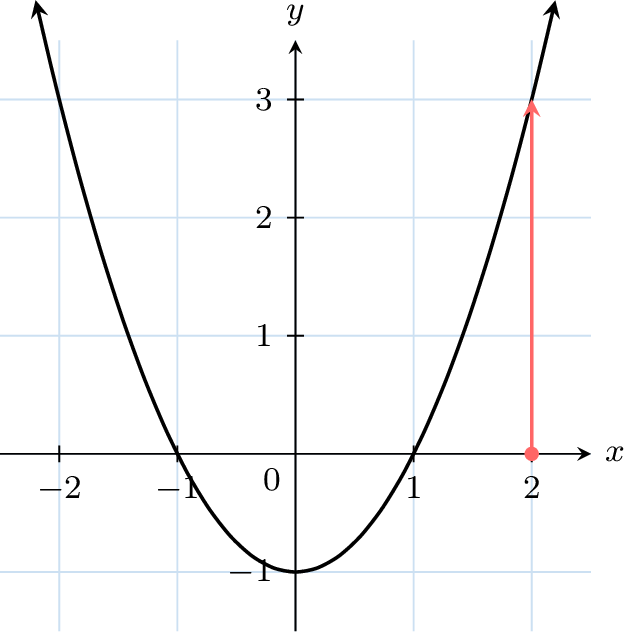
- Move vertically to the curve: From \(x = 2\), draw a vertical line up to the graph.
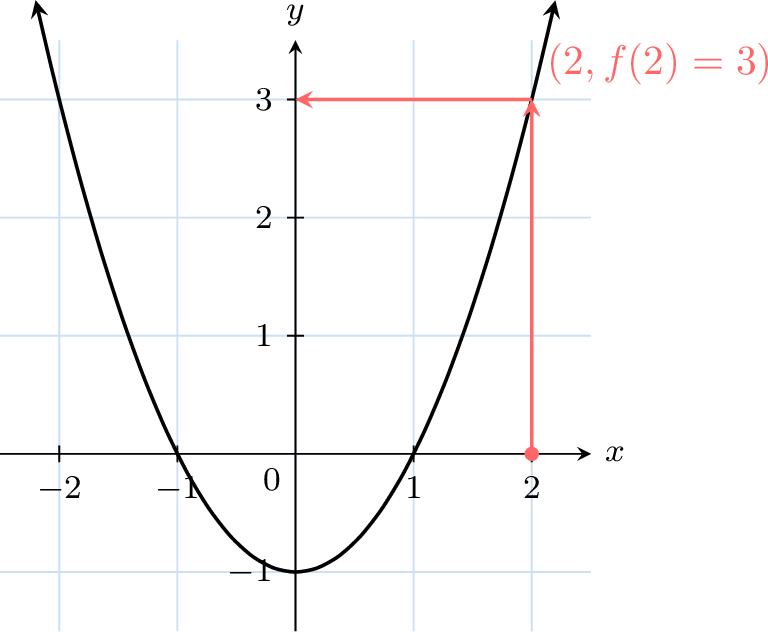
- Read the \(y\)-value: At the intersection with the curve, move horizontally to the \(y\)-axis to find the value \(f(2)\).
Method Plotting a Line Graph from a Table
To plot the graph of a function from a table of values, follow these steps:
- Plot each point \((\textcolor{colordef}{x},\textcolor{colorprop}{f(x)})\) from the table onto the coordinate plane.
- Connect the points with straight line segments.
Example
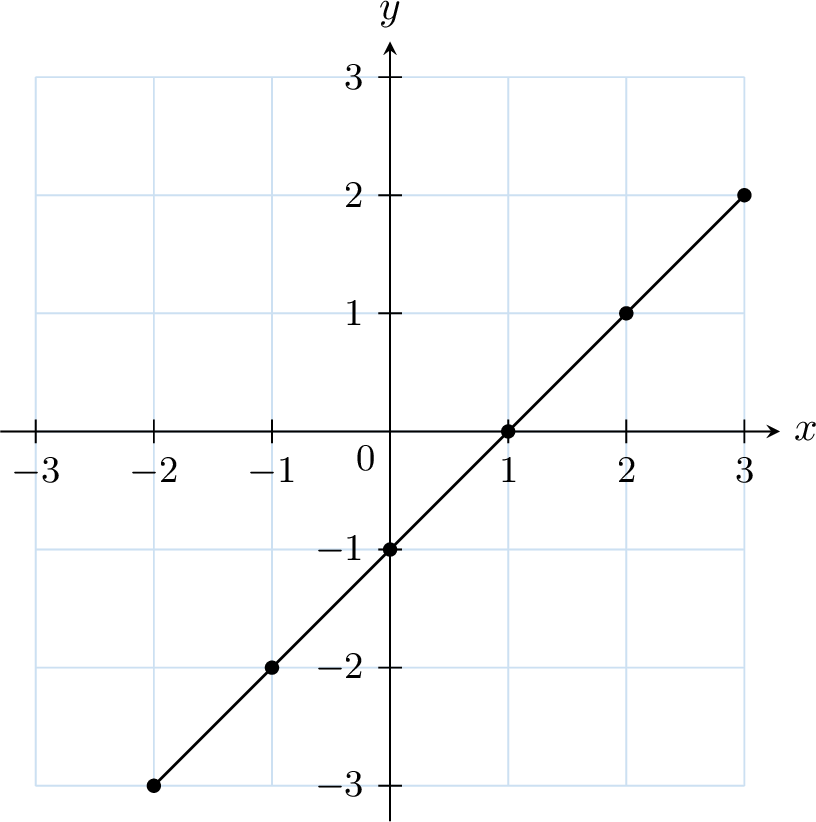
Here is a table of values for the function \(f(x) = x - 1\):
| \(x\) | \(-2\) | \(-1\) | \(0\) | \(1\) | \(2\) | \(3\) |
| \(f(x)\) | \(-3\) | \(-2\) | \(-1\) | \(0\) | \(1\) | \(2\) |
Plot the points \((-2, -3)\), \((-1, -2)\), \((0, -1)\), \((1, 0)\), \((2, 1)\), and \((3, 2)\). Then, connect the points with straight segments to form the line graph.